Real Estate Turnover and Absorption Rate Formula Examples
Absorption rates, or months on inventory, are a great way for getting a pulse of the market and a neighborhood.
Combined with turnover, real estate agents have a lot of data-driven information that will help a homeowner sell their home.
Real Estate Turnover Rate Formula
# homes sold / total number of homes
Example Turnover Calculation
How many homes are in a neighborhood?
You can get an estimated number of homes in the area by zip code at United States Zip Codes. But that probably isn’t as hyperlocal as you need.
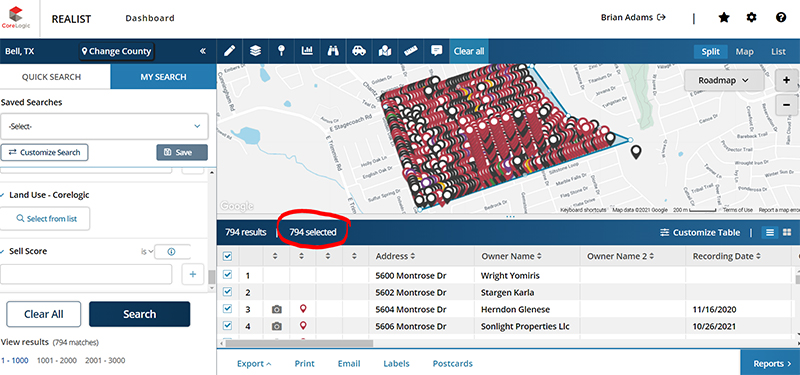
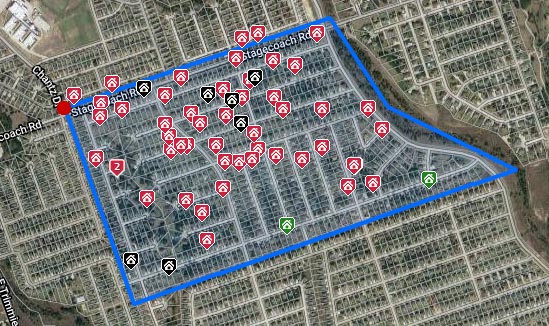
In Realist, the CoreLogic add-on for Matrix users, you can use the polygon tool to get an estimated number of homes for a specific neighborhood.
Doing this, I estimate there are 794 homes in the north part of White Rock Estates.
Then, in my MLS looking back the past 12 months, I see there were 85 sales in the same neighborhood.
85 / 796 = 10.7% turnover rate
What is a “Good” Turnover Rate?
10% seems pretty good! This is definitely a quality neighborhood to market in my area.
I searched Country Trails, an older, more expensive and established neighborhood in my neck of the woods to see how that 10% compares. It had a 5.6% turnover.
10% or more is a good turnover rate in a real estate neighborhood.
How to Calculate Months of Inventory
# homes for sale / # homes sold
Example Months of Inventory Calculation
Here is an example from a neighborhood in Killeen, TX that I pulled using CoreLogic’s Matrix. You can do something similar in your own MLS.
- 50 sales in the past 6 months
- 9 actives, pendings, under contracts, and pending-taking-backups
9 / (50 / 6) = 9 / (8.33) = 1.08 months
1.08 months of inventory
There are 8.33 homes selling each month (50 / 6). Meaning it would take just over a single month to close everything that is on the market now.
How to Calculate Absorption Rates
# homes sold / # homes for sale
If you notice, this is the reverse of the months of inventory calculation.
That means that both metrics measure the same thing. But low “months inventory” means a hot market, and high absorption rates signifies a hot market.
Example Absorption Rate Calculation
Staying with the same example above, you can see the numbers just flip positions.
(50 / 6) / 9 = (8.33) / 9 = 0.9255 = 93%
Another way of expressing this is that, at the same past of sales in the past 6 months, 93% of the active listings will be sold by the end of the month.
Remember that the “6” will change depending on how many months back you look. If you pull sales from the past 12 months, then use 12! Or just 1 if you are only looking at the past month. In small neighborhoods, 1 month may have too much noise so it’s useful to look back a few months at least to get better data.
What is a “Good” Absoprtion Rate and “Good” Months Inventory Metric?
As you can see in the neighborhood example above, Killeen, TX is really hot right now. 1.08 months of inventory and over 90% absorption rate!
As a rule of thumb, absorption rates for single-family residential homes range between 10% to 50%, 50% representing 2 months of inventory and 10% representing 10 months of inventory.
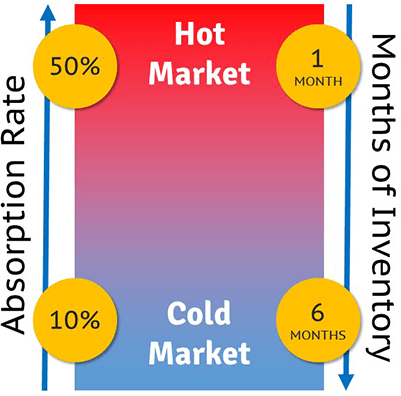
High absorption rate = hot market.
High months inventory = slow market.
How to Use Turnover and Absorption Rates as a Realtor
Listing Presentations and CMAs
Turnover and Absorption rates can tell you a lot about a neighborhood that will help you set expectations in the listing presentation, especially as related to Days on Market (DOM).
When creating and presenting your CMA, knowing your neighborhood and market speed will give a lot of context to the price you recommend. Can you get aggressive in a hot market? Or are there few enough buyers that you need to get into a competitive range as soon as possible?
If you are in a low turnover neighborhood, there may be fewer people looking for homes like those. Or there may be a lot of pent-up demand but no vacancy if it’s a hot neighborhood. The turnover is a clue to that story.
Relatedly, you are likely to see higher absorption rates and lower turnover at higher price points. It doesn’t necessarily
Below is the DOM trendline in my own market mapped by sales price (CDOM is cumulative days on market).
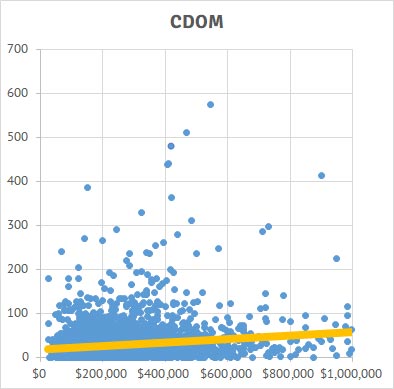
The yellow line is the trendline, clearly showing that more expensive homes have longer DOMs in my market!
Marketing
If you are choosing neighborhoods to farm, door-knock, or direct mail, picking neighborhoods with high turnover is a good way to maximize your time and conversion.
Would you rather door knock an age-restricted neighborhood with retirees who only move once every 25 years (4% turnover)? Or would you rather market to a first-time homebuyer-type neighborhood where people only live 5 years before moving up or out (20% turnover)?
Your marketing will likely produce more business in neighborhoods where people move more often, usually homes and condos that are 80%-100% of your area’s median sales price.
Conclusion
Math is no fun! But getting these basic math problems will help us be competent in our jobs and anticipate market conditions.
Be sure to check out the other math you’ll need as a real estate agent.