13 Tips for Creating Real Estate Infographics with Examples
Why Use Infographics?
- Engagement. Infographics work because they are colorful, eyecatching, and, most importantly, shareable. A Facebook visitor is far more likely to share an aesthetic and pithy infographic on your feed than a 1200 blog post (which is a good reason to combine blog posts, good for SEO, with infographics, good for sharing). According to Springer, illustrated text call-to-actions are 323% more effective than a simple text call-to-action. When lead generation is ultimately the game, that engagement translates into dollars.
- Backlinks. When you create original infographics that are unique and tell a good story, you might find others sharing it on their own real estate websites. That’s often a chance to earn a backlink to your website, which is great for SEO! That’s why you may want to consider content that is not just aimed at buyers and sellers, but also at other local agents. Even though you’re the competition, they might just be willing to include your information on their site. It might be worthwhile to reverse-image search your infographics from time to time to make sure everyone is giving you credit where credit is deserved.
- Demonstrate Expertise. You are building a brand, I hope, as the local real estate subject matter expert. That means knowing your numbers, market trends, and industry! A good infographic can go a long way to showcasing this expertise. And you may learn a thing or two doing the research for your infographics!
Features of Good Infographics
- Simple. Too many numbers and viewers will glaze over. In fact, I’m not personally a fan of the really long infographics that you scroll through. There is just too much there. Pick a highlight piece of information and focus on that. Make the takeaway clear.
- Original. You can share infographics created by others. That is fine. But to really get the most bang for your buck you can consider creating some original content. Don’t just take someone else’s infographic and rebrand it to yourself. Instead, use some primary data sources like the MLS or research reports to pull out a few feature insights and package those into your own, original infographic.
- Branded. When creating your own, you want to spread awareness. Make sure the infographic is prominently branded in your brand’s colors, logo, and even fonts. That makes it harder for other folks to “steal”, and still get brand love when they share it instead.
- Timely. Riding the wave of hot topics can be an ideal way to earn shares and go viral. The coronavirus pandemic is a great example, when consumers and agents alike were craving any clues to how the real estate market would react. Creating infographic content for your market on that subject can go a long way to earning exposure for you and your brand. You also don’t want to share infographic content that is already a few years old. That looks lazy. Instead, look for opportunities to perhaps take old, successful infographics and spice them up for this year!
- Accurate. I’m not a lawyer, but I imagine that, at the extreme, sharing inaccurate information might be grounds for a false advertising issue. At a minimum, knowingly doing so is unethical and perhaps incompetent – violations of your Code of Ethics. Be sure to include the source and information about data you gathered yourself. For example: Information from the CTXMLS, Bell County single-family homes, closing date between 8/1/2020 and 8/31/2020.
Sourcing Info for Infographics
- MLS. Real estate agents have one of if not the best real estate databases at their fingertips. Use it! You can look up all sorts of information to make your own infographics. What is the average $/sqft for pool homes vs. non-pool homes? What is the most expensive sale price in each zip code to sell in the past year? What month do the most homes go under contract in your market? There’s literally an infinite number of infographics you can create from the MLS.
- NAR. The National Association of Realtors does its own research on topics, to include the essential Profile of Home Buyers and Sellers. This report in particular is a goldmine of information you can repackage into infographics, including comparing how much more agent-represented sellers get versus FSBO sellers, or buyer’s favorite method for browsing homes.
- Brokerage. Your brokerage may have research, information, or graphics based on its own operational experience that can be made available via infographic. Many may have their own infographics already that are very shareable.
- Portals. Zillow and Realtor.com have research centers that regularly put out information, either in infographic format or info you can use to create your own infograph. For example, Realtor.com has markets broken down by how hot they are, or even the different areas trending by age category. Realtor.com even has a hub of infographics you can repurpose for your site.
- Vendors. Many technology vendors in the real estate space study their own niche and make those reports available. For example, here is a study of referrals from ReferralExchange, or a report on CMAs from Cloud CMA. Look up vendors in field you want some stats on and Google their name and “research” and see if anything good comes up.
Share or Make Your Own?
Making your own infographic is a great way to earn backlinks from folks who might share it, and can also be an opportunity to get your own brand out there when they do.
But it is not essential that every infographic you use be your own.
When sharing someone else’s infographic, be sure to give credit to where it came from, to include a link. This is just common courtesy, but also allows folks to check on the source of any figures you are sharing.
Great Real Estate Infographic Examples
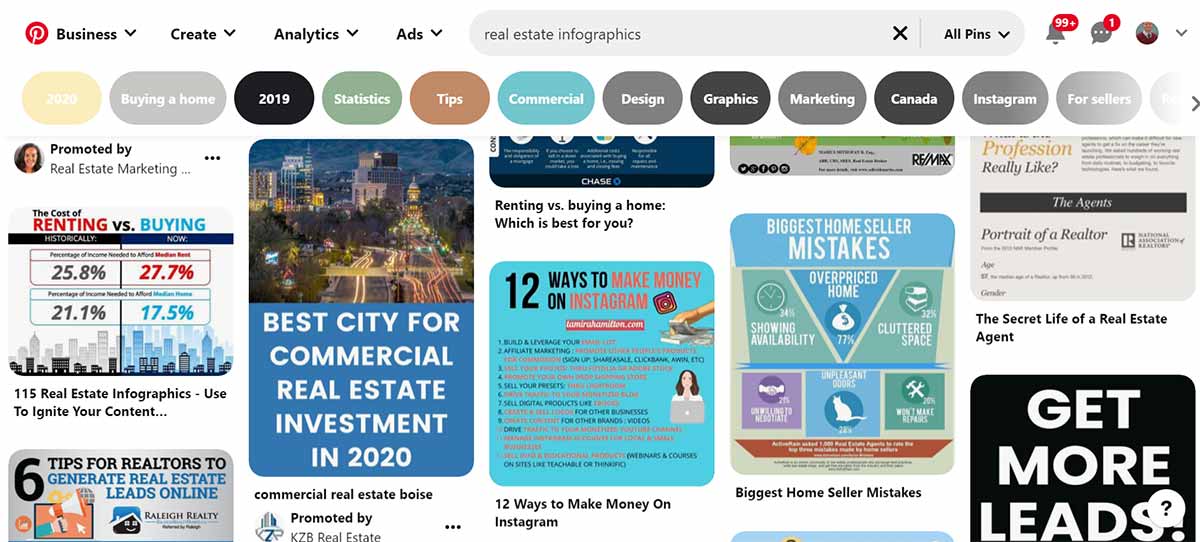
Pinterest is chock full of free real estate infographics that you can just grab and share, or inspire you.
It’s the perfect place to brainstorm some ideas for what to share with your own audience, and take other infographics that are either old or in other markets and adapt it to your own market.
Some examples infographics floating around there are the benefits of home staging, the ROI on certain home repairs, top concerns for a first time home buyer, top mistakes FSBOs make trying to sell a home.
Neighborhood Area Report
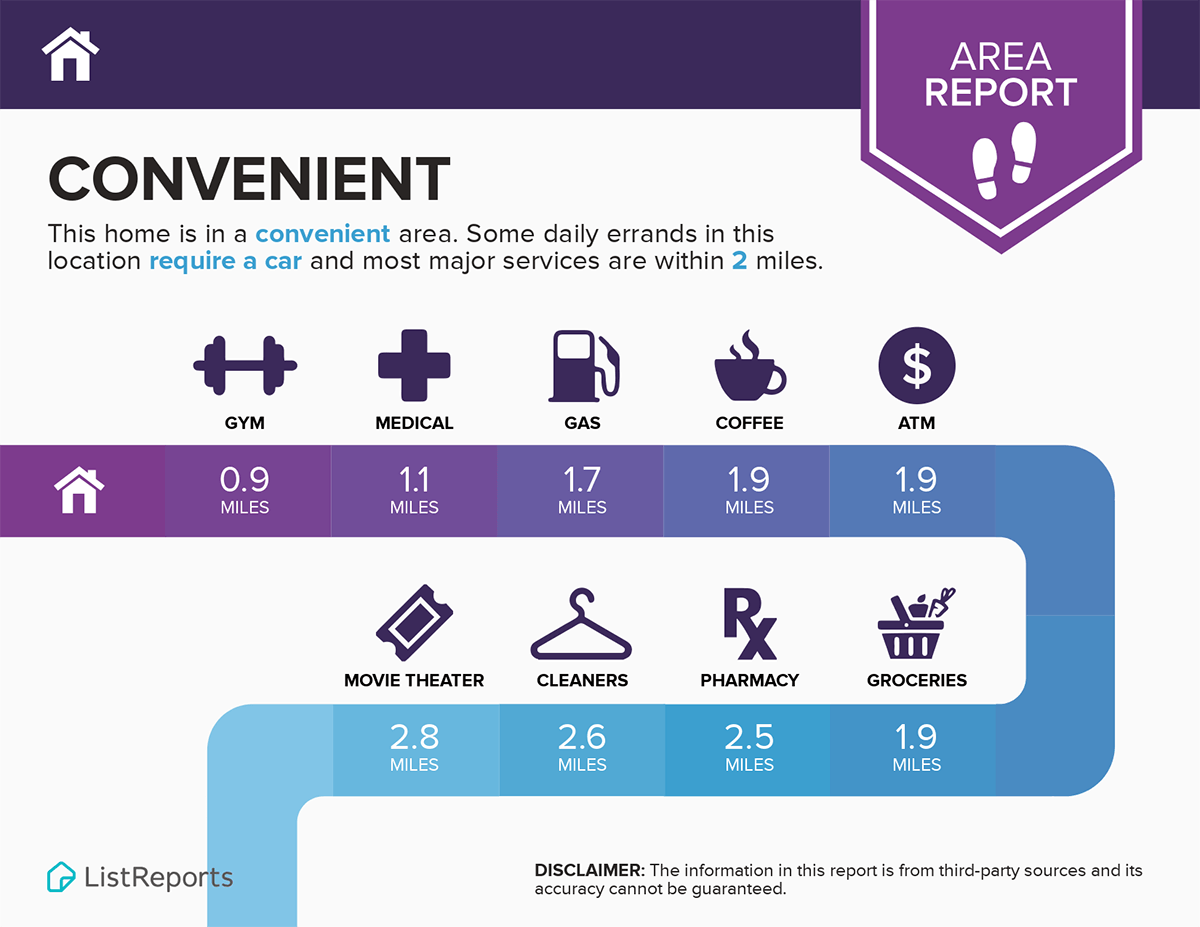
Unlike the market report which usually talks about monthly or annual real estate stats, creating a neighborhood infographic can be timeless.
The above example from ListReports uses a variety of information from their system to describe the availability of local amenities. You could do something even simpler by just highlighting the most prominent area features like parks, schools, and entertainment.
Mortgage Interest Rates
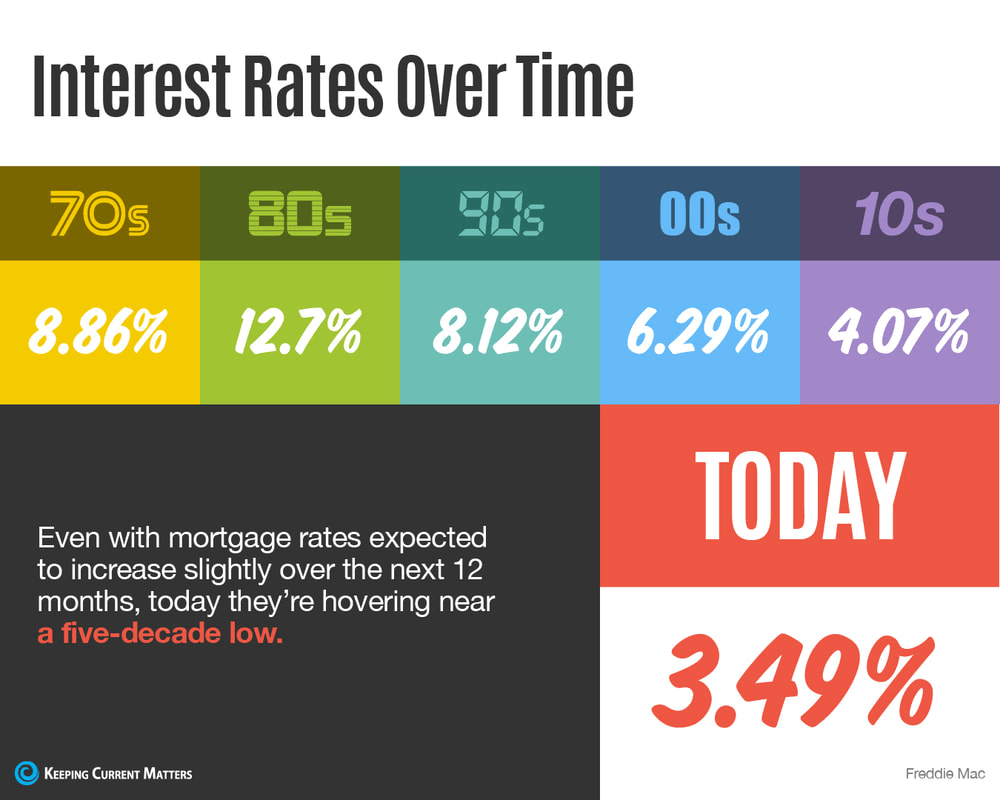
Monitoring interest rates is relevant for buyers and sellers alike! Obviously with low interest rates, buyers might be willing to make the leap to lock in interest rates today.
As interest rates rise, sellers may want to learn more about assumptions and how their own low-interest rates can help the marketability of their home.
Does anyone still know how to do an assumption loan?
Research

A lot of the big players like Zillow and Realtor.com do research on the industry. Remember, their primary customers are agents. They are looking for ways to help agents better understand their environment and convert the leads they are buying.
Other firms to check out might include the consulting organizations or publishers like Real Trends, T3 Sixty, WAV Group, Mike DelPrete, or more.
Relevant Current Events
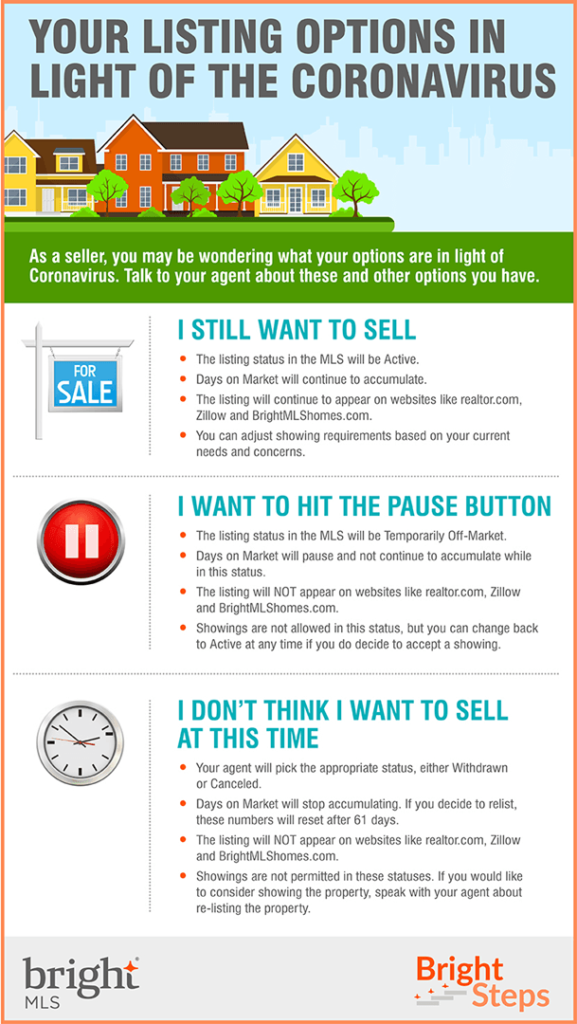
This example from BrightMLS was an opportunity to help would-be home sellers better contemplate their options when COVID first began wreaking through America.
This is a great example of an MLS providing quality content for its membership while serving area homeowners.
Self Promotional

There’s nothing wrong with bragging a little! Especially your end of year stats, it may be an okay time to take a victory lap and celebrate your wins! If you provide good service and are a strong member of your community, I guarantee your community will celebrate with you.
Macroeconomic Picture
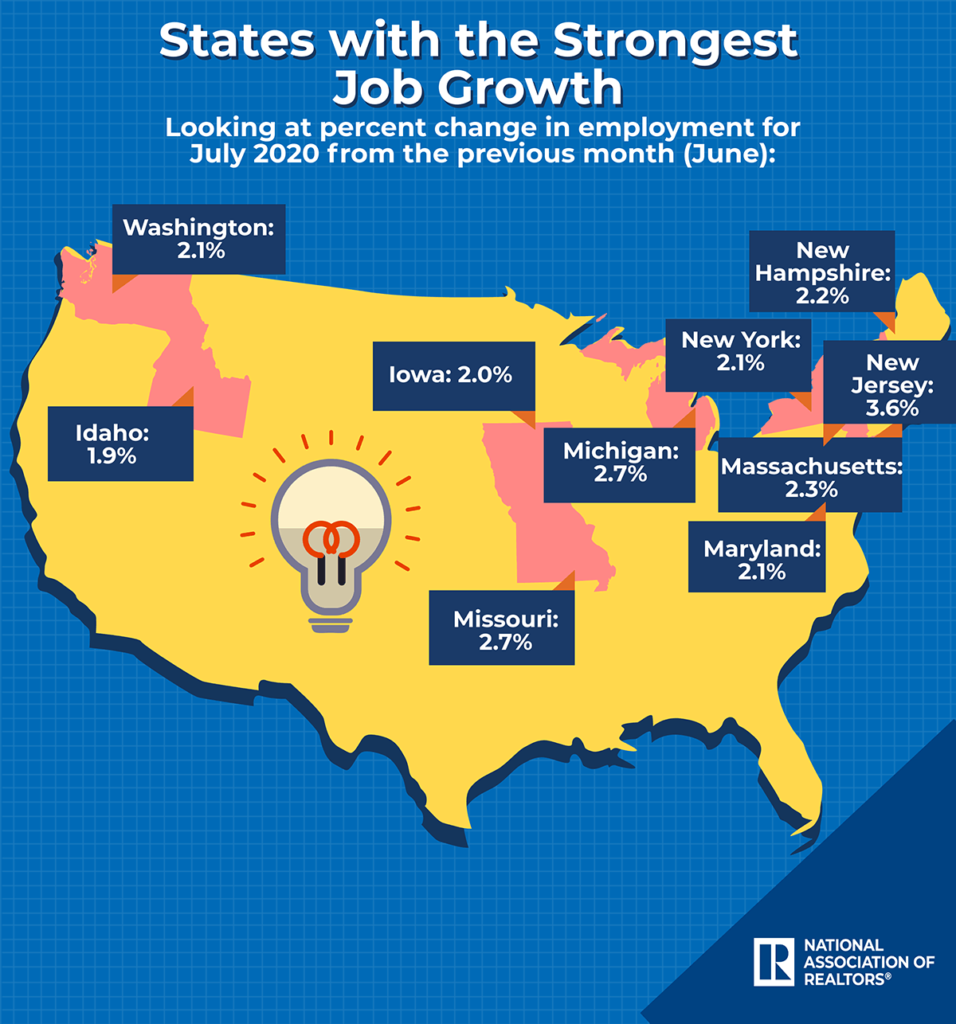
Are all the Californians moving to Texas? That is the kind of stuff that can be shareworthy in a Facebook feed if you can put numbers to it in a simple, bright way.
While an agent is often best off sharing hyperlocal information, the 30,000 foot view can still be good content.
Market Update
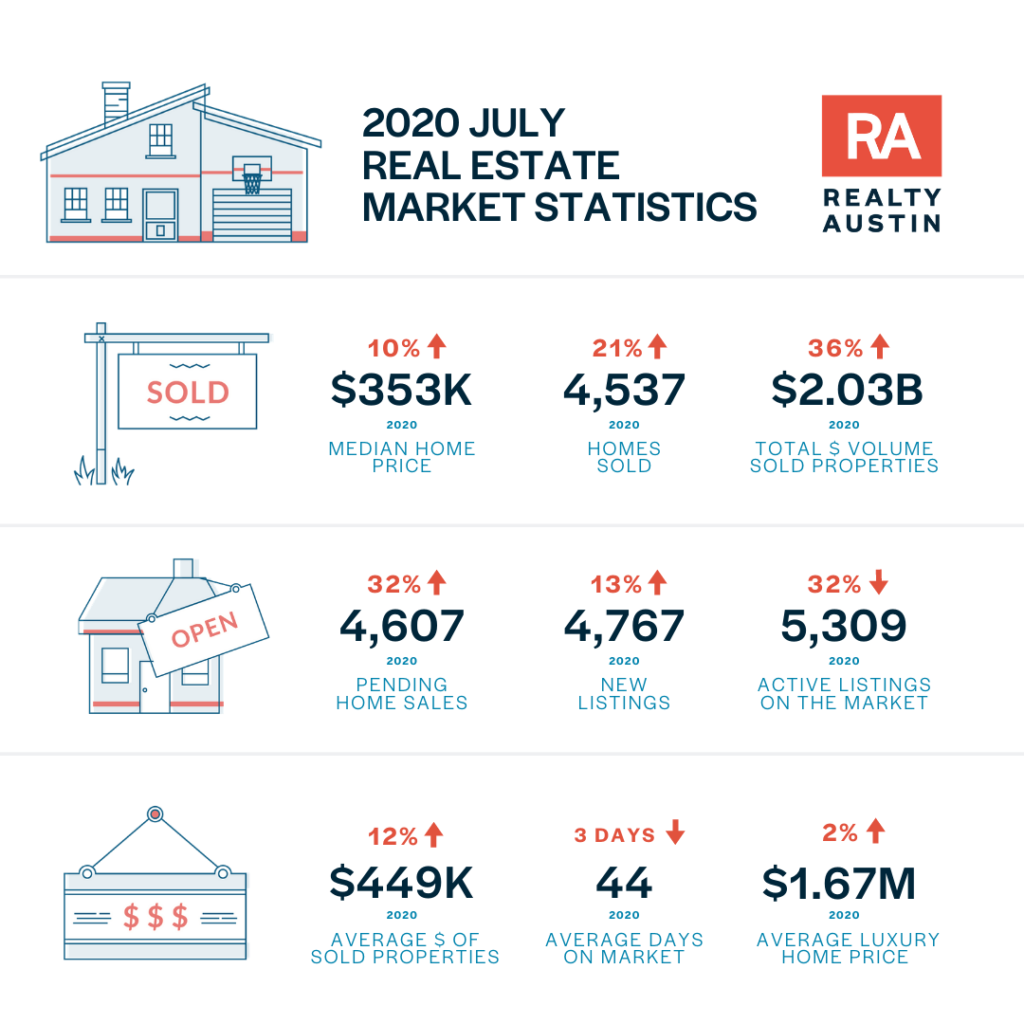
The classic purpose of an infographic: monthly market stats. Many MLSs publish these as their own infographic, but you would do well to take those same stats and make them your own in your brand.
Consider picking out only the most interesting trends that say something. Are pendings up 12% good? How about “there have never been more pending homes in MLS history in the month of August”. That is an additional quality that tells a story!
Video Market Update
Using video software, you can make your infographics even more engaging by animating them!
This might have been a pain 10 years ago, but there are many simple tools available that allow you to quickly create engaging video graphics like these without sinking too much of your time.
Make Your Own in Canva
Canva
FREE+. Canva allows you to create custom graphics, selecting from templates available or starting from scratch. It’s especially handy for a good infographic. These graphics are ideal for sharing to social media, making infographics to earn backlinks or create shareable content, supercharge blog posts with branded imagery, or deck out a listing presentation.
Alternative infographic tools include Piktochart or Infogram.
Make Video Infographics in Animaker
If you want an affordable, DIY way to make animated videos, including animated infographics, Animaker is an easy-to-use option.
Animaker 2.0 is in beta as of this writing and they are updating their product.
Infographic Services
Venngage
Venngage is a infographic company that …. well, makes infographics! They have templates, training, and numerous features for the serious infographic enthusiast.
Fiverr
$5+. Fiverr is a freelancing site that features affordable professionals for nearly every conceivable remote or digital task. It’s a popular destination to find designers, e-commerce pros, developers, social media experts, SEO, publishing, data entry, and more.
Freelance sites like Fiverr are a great place to get quality infographic for pretty cheap. Make sure they fully understand your brand and have your brand information, as well as understand the primary point of the data so that they can use their creativity to emphasize the takeaways.
ListReports
FREE+. ListReports is a lender/agent marketing suite that includes open house tools and listing marketing tools. It also includes monthly market and property updates that you can send to your sphere. It is free for agents, but there is a paid version for lender partners who are the main customer. You can also pay for some things like direct mail and signs.
ListReports offers 4 simple area infographics as part of their service, including:
- Area Report
- Outdoor Report
- Neighborhood Eats
- Schools Report
Conclusion
Infographics is a great marketing strategy to lean into a visual brand for their real estate company. It’s especially useful, in my opinion, for bloggers, who want to make quality content even more shareable.
There’s a lot to work with outside boring old trends in home prices. Craft something unique and spunky! Maybe even be silly with it.
It will bring your social media and website to life.